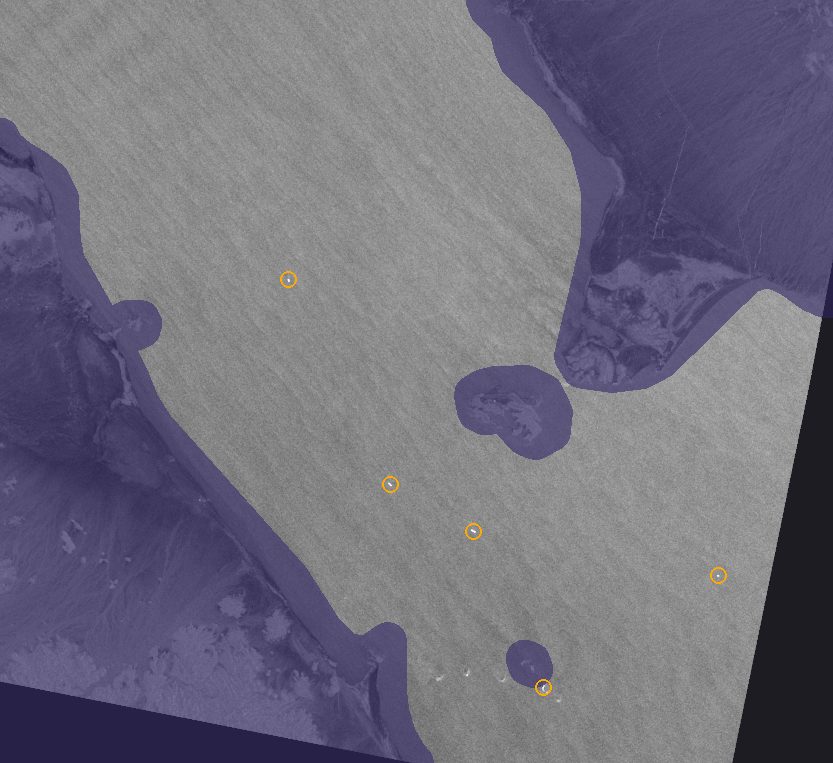
Strait of Hormuz
Radar · latest full pass 21 Oct 2026, 02:14 UTC
21 hulls in open water on that pass
Over the last 14 days: median 26 across 3 full passes (lowest 21, highest 41).
Reference, 2025, the last full year before the war: median 47 per pass over 83 passes. Now: ~55% of that.
What is counted: hulls in open water in the strait's shipping lanes and approaches at the moment of the pass, crossing or waiting; anything in one spot for most of the last six weeks is left out. Radar does not say whose a hull is, or whether it crossed the strait.
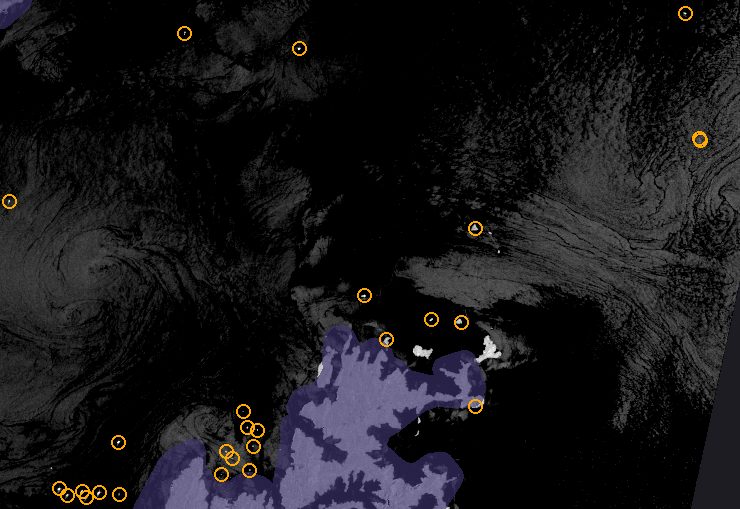
Every radar pass over the Strait of Hormuz and Bab el-Mandeb, as it lands. A free account opens the Situation Monitor, rebuilt every 15 minutes, and every headline 30 minutes after it lands. No card needed.
Create a free accountFounding offer: the first 100 yearly members pay US$290 a year for as long as they renew. Checkout shows it while places remain.
Same time, different counts
Strait of Hormuz, 23 Sep 2026: ships
Reuters could not verify the official's figure.
Strait of Hormuz, 1 Sep 2026: ships
Strait of Hormuz, week to 11 Sep 2026: ships a day
Strait of Hormuz, 31 Aug 2026: barrels
Over 17 million barrels in one day
US Energy Secretary Chris Wright (party to the war)
2 Sep 2026 · source
TankerTrackers' figure also includes the UAE's exports that bypass the strait.
Strait of Hormuz, 23 Sep 2026: barrels
~22 million barrels in one day
An unnamed US official (party to the war)
24 Sep 2026 · source
TankerTrackers' figure is a daily rate of crude at the US blockade line.
Strait of Hormuz, 18–20 Sep 2026: ships a day
Over 30 ships a day
US Naval Cooperation and Guidance for Shipping (NCAGS), relayed by UKMTO (party to the war)
21 Sep 2026 · source
The US counted the transits it facilitated; UKMTO said passages stayed in single digits.
Estimated crossings a day
Radar estimate, 24 Sep 2026 to 24 Oct 2026; range 19 to 38
~27 hulls crossing a day E Indicated
Radar never sees a ship cross. It sees the strait for a moment every one to three days, and this estimate is built from those moments, with every step below. It counts every hull, AIS or not, warships and Iranian-linked tankers included, so the trackers' AIS counts should read lower.
How the estimate is made, in 6 steps
- Large hulls: a median of 16 on each of 8 full radar passes (in 2025, 41). Hulls of 3 or more radar pixels, each about 40 m square; small craft are left out.
- Waiting: 29% of them sat within 750 m of a hull on a pass 24 to 48 hours earlier, after taking off the matches chance alone gives (in 2025, 7%). A crossing takes a few hours, so these were waiting.
- Not waiting: 16 × (1 − 29%) = 11.3 hulls a pass (in 2025, 38.3).
- Before the war each of those hulls stood for 2.6 to 3.6 crossings a day: 38.3 hulls against the pre-war counts of 100 (Al Jazeera), 125 (Reuters), 130 (Windward), 138 (gCaptain) a day. At the middle count, 11.3 hulls make about 38 crossings a day.
- That rule reads high in a war. Set up on Bab el-Mandeb before the Houthi attacks and run on the months after the July 2026 blockade declaration, where trackers see well, it came out at 1.2 to 1.9 times their counts: warships, escorts and ships repositioning are in the strait without crossing it. Scaled down by that: about 27 a day.
- The range, 19 to 38, is the middle 80% of 4,000 recalculations: each pre-war count equally likely, the Bab el-Mandeb correction anywhere in its range, and the radar passes resampled.
The size of hull counted matters most. The biggest hulls nearly all stopped in the war and the mid-sized ones did not, so counting only bigger hulls gives less: for Sep 2026, from 4 pixels, 15; from 5 pixels, 11; from 6 pixels, 6 a day, against 21 from 3 pixels. Those stricter cuts miss real crossings: they fall below the 16.7 a day Lloyd's List Intelligence counted from AIS for 14–20 Sep 2026, a count of non-Iranian-linked transits of cargo vessels over 10,000 dwt alone, and crossings cannot be fewer than a count of some of them.
By month since the war began
| Month | Estimate a day | Range | Radar passes | Waiting |
|---|---|---|---|---|
| Mar 2026 | ~8 | 4–12 | 10 | 62% |
| Apr 2026 | ~33 | 22–45 | 10 | 29% |
| May 2026 | ~41 | 31–52 | 13 | 32% |
| Jun 2026 | ~31 | 21–44 | 12 | 34% |
| Jul 2026 | ~22 | 16–30 | 10 | 18% |
| Aug 2026 | ~25 | 18–33 | 10 | 32% |
| Sep 2026 | ~21 | 15–28 | 10 | 40% |
How the correction was measured: Bab el-Mandeb
Set up on Bab el-Mandeb, January 2022 to 18 November 2023, before the Houthi attacks: 10.7 hulls not waiting a pass, against 77.4 crossings a day (Lloyd's List Intelligence, 542 a week before the attacks), so 7.3 a day each. That period had one satellite and no passes a day apart, so its waiting share is 2025's (11%); after the blockade declaration it was 16%. Each tracker's count, over the radar estimate for the same days, is a correction.
| Tracker | Days covered | Their count a day | Radar estimate a day | Tracker ÷ radar |
|---|---|---|---|---|
| Windward (maritime analytics)crossings per day | after the 20 Jul 2026 Houthi blockade declaration | 37.2 | 61.0 | 0.61 |
| Lloyd's List Intelligencetransits in the month | August 2026 | 37.6 | 61.0 | 0.62 |
| Kplervessels crossing over the weekend | weekend of 19–20 Sep 2026 | 25.5 | 48.8 | 0.52 |
| Reuters, from preliminary ship-tracking datacommodity vessels transiting in one day | Wednesday 23 Sep 2026 | 27.0 | 48.8 | 0.55 |
| Lloyd's List Intelligencetransits of cargo vessels over 10,000 dwt | 21–27 Sep 2026 (preliminary) | 41.4 | 48.8 | 0.85 |
Graded E, indicated: a model, not a count. The trackers' AIS counts in the table below should read lower. A published figure well above the range needs more hulls in the strait than radar sees, or ships passing through much faster than before the war.
Published figures, graded: ships
| Published | Figure | Who | How it was counted | Grade |
|---|---|---|---|---|
| 6 Oct 2026 | 203 ships/weekvessel crossings in the week · 21–27 Sep 2026, restated | Kpler (Risk and Compliance)as reported by DataPortuaria · source | Kpler Risk and Compliance, from MarineTraffic ship tracking | A Measured |
| 6 Oct 2026 | 157 ships/weekvessel crossings in the week · 28 Sep to 4 Oct 2026 | Kpler (Risk and Compliance)as reported by DataPortuaria · source | Kpler Risk and Compliance, from MarineTraffic ship tracking | A Measured |
| 6 Oct 2026 | 14 tankers/dayconfirmed tanker crossings a day, 7-day average · the 7 days to 4 Oct 2026 | Kplersource | AIS, optical and radar satellite imagery and human intelligence; a crossing counts once confirmed | A Measured |
| 6 Oct 2026 | 8 tankers/dayconfirmed tanker crossings in one day (6 out, 2 in) · Sunday 4 Oct 2026 | Kplersource | AIS, optical and radar satellite imagery and human intelligence; a crossing counts once confirmed | A Measured |
| 1 Oct 2026 | 6 tankers/dayconfirmed tanker crossings in one day · Tuesday 29 Sep 2026 | Kplersource | AIS, optical and radar satellite imagery and human intelligence; a crossing counts once confirmed | A Measured |
| 30 Sep 2026 | 17 ships/dayvessel transits in one day · Tuesday 29 Sep 2026 | Windward (maritime analytics)as reported by The Maritime Executive · source | Windward's tracking data | A Measured |
| 30 Sep 2026 | 16 ships/dayvessel transits in one day · Monday 28 Sep 2026 | Windward (maritime analytics)as reported by The Maritime Executive · source | Windward's tracking data | A Measured |
| 30 Sep 2026 | 117 ships/weeknon-Iranian-linked transits of cargo vessels over 10,000 dwt · 14–20 Sep 2026 | Lloyd's List Intelligencesource | Lloyd's List Intelligence transit monitor; Iranian-linked ships excluded | A Measured |
| 29 Sep 2026 | 55 transits in 8 daysAIS-visible transits over the period · 16–23 Sep 2026 | Windward (maritime analytics)as reported by Windward · source | AIS detections combined with at least one satellite image pass a day | A Measured |
| 28 Sep 2026 | 132 ships/weekvessel crossings in the week · 21–27 Sep 2026, as first published | Kpler (Risk and Compliance)as reported by DataPortuaria · source | Kpler Risk and Compliance, from MarineTraffic ship tracking | A Measured |
| 24 Sep 2026 | 60 ships/daycommercial vessels transiting in one day · Wednesday 23 Sep 2026 | An unnamed US official (party to the war)as reported by Reuters, via Arab News · source | not stated; Reuters could not independently verify it | D Claimed |
| 24 Sep 2026 | 10 ships/daycommodity vessels transiting in one day · Wednesday 23 Sep 2026 | Reuters, from preliminary ship-tracking dataas reported by Reuters, via MarineLink · source | preliminary ship-tracking data; the 10-day average was about 17 | A Measured |
| 21 Sep 2026 | 10 ships/dayvessel transits a day · Friday 18 to Sunday 20 Sep 2026 | UK Maritime Trade Operations (UKMTO)as reported by Demócrata, from news agencies · source | not stated | B Official |
| 21 Sep 2026 | 30 ships/dayvessel transits a day facilitated by the US, 72-hour average · the 72 hours to about 21 Sep 2026 | US Naval Cooperation and Guidance for Shipping (NCAGS), relayed by UKMTO (party to the war)as reported by Demócrata, from news agencies · source | not stated: the US count of transits it facilitated | D Claimed |
| 21 Sep 2026 | 17 ships in 2 dayscommodity vessels transiting over the weekend · weekend of 19–20 Sep 2026 | Kpleras reported by Reuters, via MarineLink · source | Kpler ship-tracking data; 37 the weekend before | A Measured |
| 11 Sep 2026 | 20 ships/dayUS-stated facilitated transits on the southern route, per day · the seven days UKMTO reported on 11 Sep 2026 (dates not given) | The US government, as compiled by UKMTO (party to the war)as reported by gCaptain · source | US statements of the transits it facilitated: 86 outbound and 79 inbound in the week | D Claimed |
| 11 Sep 2026 | 6 ships/dayAIS-derived transits per day · the seven days UKMTO reported on 11 Sep 2026 (dates not given) | UKMTO (UK Maritime Trade Operations)as reported by gCaptain · source | AIS-derived: 22 outbound and 23 inbound in the week | B Official |
| 3 Sep 2026 | 40 ships/daycommercial ships passing under US military escort in one day · Tuesday 1 Sep 2026 | Two US officials (party to the war)as reported by CNN, as cited by Al Jazeera · source | not stated | D Claimed |
| 3 Sep 2026 | 11 ships/dayvessels crossing the strait in one day · Tuesday 1 Sep 2026 | Kpleras reported by Al Jazeera · source | Kpler ship-tracking data; its 10-day average was 13 a day | A Measured |
| 2 Sep 2026 | 30 ships/nightships a night getting through with US Navy help · said on Monday 31 Aug 2026; the period was not given | President Donald Trump (party to the war)as reported by Fortune · source | not stated | D Claimed |
| 22 Aug 2026 | 3 ships/daytanker crossings per day not facilitated by the US · 17–19 Aug 2026 | JMIC (Joint Maritime Information Center)as reported by gCaptain · source | JMIC's own tracking of tankers sailing without US facilitation | B Official |
| 22 Aug 2026 | 21 ships/dayUS-facilitated vessel transits per day · 18–19 Aug 2026 | US Navy coordination data, as recorded by JMIC (party to the war)as reported by gCaptain · source | 42 US-facilitated transits over two days | D Claimed |
| 2 Jun 2026 | 24 ships/dayvessels transiting with IRGC permission in 24 hours · the 24 hours to 2 Jun 2026 | The IRGC Navy (Iran's Revolutionary Guard) (party to the war)as reported by Press TV, via GlobalSecurity.org · source | IRGC statement; counts only ships that obtained its permission | D Claimed |
Published figures, graded: oil volumes
Reference for oil volumes: TankerTrackers.com
PANOPT's reference for oil volumes. TankerTrackers counts tankers from daily satellite imagery, shoreside photography and AIS, and specialises in tankers sailing with their transponders off, the ones AIS-only counts miss. It says what each figure covers, for example when exports that bypass the strait are included. It is one firm's estimate, not an official statistic, and its figures here are as the press reported them.
- 13 million barrels a dayestimate given on Wednesday 23 Sep 2026crude oil leaving through the US blockade line, per day. source
- 8.27 million barrels a daythe seven days to 31 Aug 2026oil leaving the Arabian Sea, seven-day average, bypass exports included. source
- 9.14 million barrels in one dayMonday 31 Aug 2026oil leaving the Arabian Sea in one day, Hormuz and the UAE's Gulf of Oman exports together. source
- 4.63 million barrels in one dayWednesday 2 Sep 2026oil leaving the Arabian Sea in one day, bypass exports included. source
- 6.81 million barrels in one dayTuesday 1 Sep 2026oil leaving the Arabian Sea in one day, bypass exports included. source
| Published | Figure | Who | Grade | Reference, same period |
|---|---|---|---|---|
| 6 Oct 2026 | 9.62 million barrels a dayconfirmed oil transits of the strait, Iran excluded, 7-day average · 7-day average to 4 Oct 2026 | Kplersource | A Measured | — |
| 6 Oct 2026 | 7.82 million barrels in one dayconfirmed oil transits of the strait in one day, Iran excluded · Sunday 4 Oct 2026 | Kplersource | A Measured | — |
| 5 Oct 2026 | 3–4 million barrels a dayoil moving through the US-supervised route a day · as stated on Sunday night, 4 Oct 2026 | IRGC commander Ali Fadavi (party to the war)source | D Claimed | — |
| 4 Oct 2026 | 6.02 million barrels a daytotal oil flows through the strait, monthly average · September 2026 | Kplersource | A Measured | — |
| 2 Oct 2026 | 9.9 million barrels a daycrude physically crossing the strait, average · 1–28 Sep 2026 | Kplersource | A Measured | — |
| 2 Oct 2026 | 7.84 million barrels a dayconfirmed oil transits of the strait, Iran excluded, 7-day average · 7-day average to 30 Sep 2026 | Kplersource | A Measured | — |
| 1 Oct 2026 | 677,000 barrels a dayrefined products through the strait, seven-day average · the seven days to 28 Sep 2026 | Kplersource | A Measured | — |
| 1 Oct 2026 | 13.5 million barrels a daycrude transiting the strait, seven-day average · the seven days to Monday 28 Sep 2026 | Kplersource | A Measured | — |
| 30 Sep 2026 | 13.1 million barrels a dayoil and products through the strait, weekly average · the week before 30 Sep 2026 | Kplersource | A Measured | — |
| 29 Sep 2026 | 26.72 million barrels in 3 dayscrude leaving through the strait over three days · 20–22 Sep 2026 | Windward (maritime analytics)source | A Measured | — |
| 29 Sep 2026 | 11.2 million barrels a daycrude through the strait, weekly average · the latest week, to about 29 Sep 2026 | Vortexasource | A Measured | — |
| 28 Sep 2026 | 9 million barrels a daycrude through the strait, including ship-to-ship transfers in the Gulf of Oman, 7-day average · 7-day average to 22 Sep 2026 | Kplersource | A Measured | — |
| 27 Sep 2026 | Over 20 million barrels in one dayoil out of the strait in one day · one day in the week before 27 Sep 2026 | US Energy Secretary Chris Wright (party to the war)source | D Claimed | — |
| 27 Sep 2026 | ~13 million barrels a dayoil through the strait, running average · running average, as of 26-27 Sep 2026 | US Energy Secretary Chris Wright (party to the war)source | D Claimed | — |
| 24 Sep 2026 | ~22 million barrels in one dayoil leaving the strait in one day · Wednesday 23 Sep 2026 | An unnamed US official (party to the war)source | D Claimed | 13 million barrels a day · estimate given on Wednesday 23 Sep 2026 |
| 19 Sep 2026 | ~10 million barrels a daycrude and products moving through the strait per day · said 13 Sep 2026; the period was not given | US Energy Secretary Chris Wright (party to the war)source | D Claimed | — |
| 18 Sep 2026 | 7.6 million barrels a dayoil flows through the strait, monthly average · August 2026 | International Energy Agencysource | B Official | — |
| 3 Sep 2026 | ~18 million barrels in one dayoil carried by the ships passing under US escort in one day · Tuesday 1 Sep 2026 | Two US officials (party to the war)source | D Claimed | 6.81 million barrels in one day · Tuesday 1 Sep 2026 |
| 3 Sep 2026 | 15–17 million barrels in one dayoil through the strait in one day · Monday 31 Aug 2026 | US Treasury Secretary Scott Bessent (party to the war)source | D Claimed | 9.14 million barrels in one day · Monday 31 Aug 2026 |
| 3 Sep 2026 | At least 10 million barrels a dayoil getting through the strait per day · each day; the period was not given | US Treasury Secretary Scott Bessent (party to the war)source | D Claimed | 8.27 million barrels a day · the seven days to 31 Aug 2026 |
| 2 Sep 2026 | Over 17 million barrels in one dayoil through the strait on ships in one day · Monday 31 Aug 2026 | US Energy Secretary Chris Wright (party to the war)source | D Claimed | 9.14 million barrels in one day · Monday 31 Aug 2026 |
| 22 Aug 2026 | Over 15 million barrels in one dayoil and products shipped out of the strait with US military help in one day · Tuesday 18 Aug 2026 | US Energy Secretary Chris Wright (party to the war)source | D Claimed | — |